Header Graphic
Dyno Runs...

As soon as weather in Wisconsin permitted it in spring 2006, I started putting miles on the car.  The DTA controller is excellent at generating an A/F correction table based on feedback from a wide band lambda sensor.  The normal driving range was easily mapped, but rate of change of the rpm was too fast for power tuning. So in July after about 1500 road miles, the car was put on a rolling road.

3 hours was spent on the dyno tuning the low end of the engine, but the tuning was limited to 7500 rpm because the dyno had a 120 mph speed limit.  The last 45 minutes of the day was wasted waiting on the technician to figure out how to remove the speed limit.  So I snapped a few pictures.

The main purpose of this dyno run was tuning and that was accomplished below 7500 rpm.  Max hp for the day was 264 rear wheel hp at 7500 rpm. That is about 325 flywheel hp.  Well within expectation for the smaller 2.6 liter version of this engine which develops peak hp at 9500 rpm.

In December 2006 after 3500 miles, the car was again put on the rolling road.  This time to get some horsepower numbers.  20 pulls were done at full throttle.  A/F ratio was as lean as 13.5:1 in spots.  Power went up as it was richened to 12.5:1.  Adding a few degrees of advance also added a few horsepower.

The final result was 306.2 rear wheel hp @ 9500 rpm and 191 ft-lbs torque.  That is about 375 hp at the flywheel.  That is better than expected for this 2.6 liter engine with stock street cams.

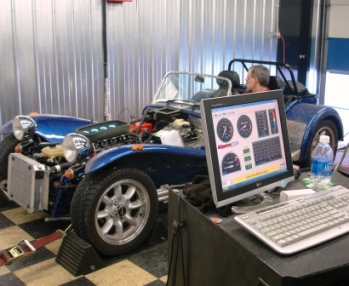
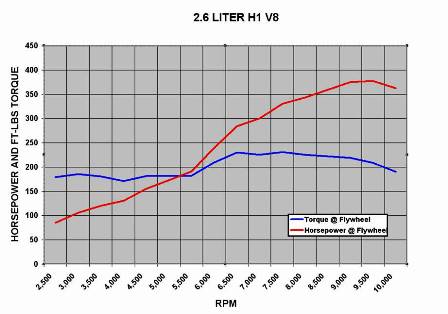
Wheel torque and horsepower are converted to flywheel horsepower and torque in the chart to the rights.  19% losses are assumed in the conversion.  Note the torque curve is fairly flat showing 180 lb-ft torque as low as 2800 rpm (at the flywheel).

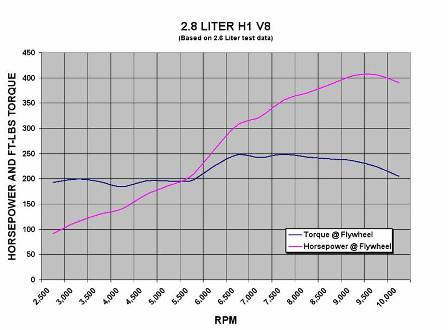
Extrapolating, the 2.8 liter version with 7.7% more displacement and higher compression ratio of 12.5:1 will be bit better than 400 hp.

See the video on the December dyno run on the Dyno Video page.


Link to Dyno Video page...

or Return Home...